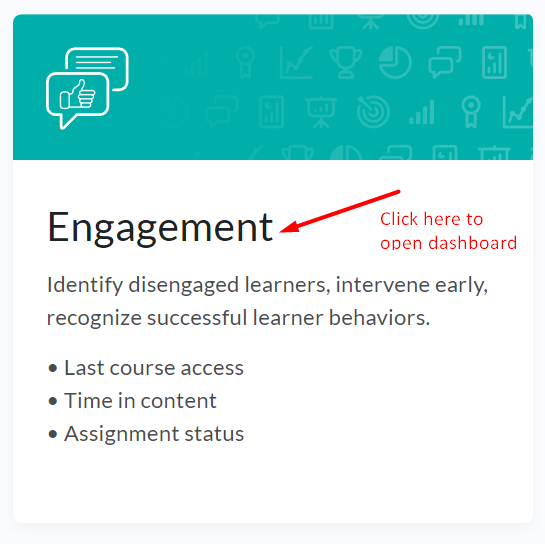
Engagement Dashboard
Allows users to identify individuals or groups who are succeeding or are at-risk. This includes visualizations for last course access, assignment completions, and time spent in content.
Accessing the Engagement Dashboards
- Click on the tile to open the Engagement Dashboard.
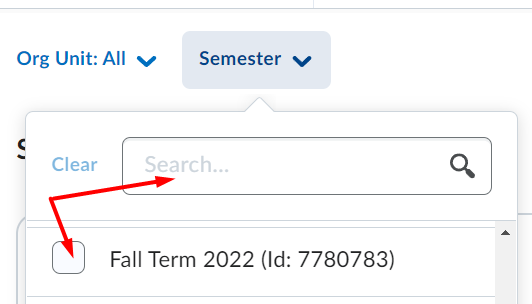
- Select one or more semesters from the drop-down menu. The three most recent semesters
will be displayed by default. A specific semester can also be entered in the search
box.
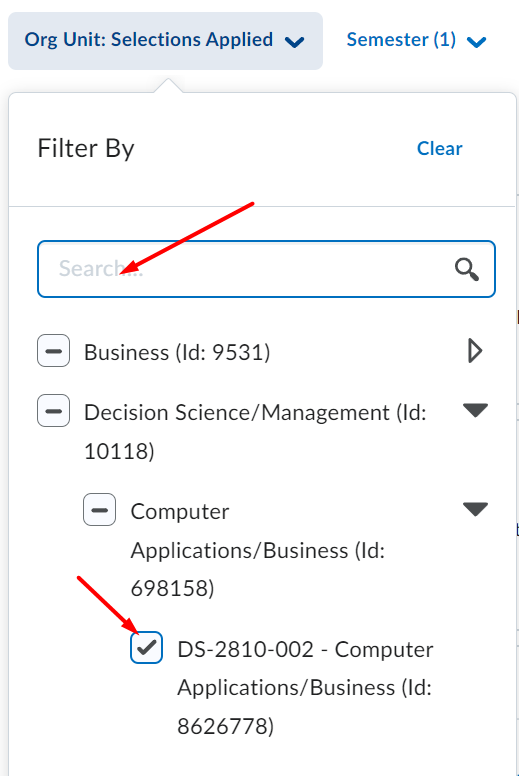
- Search or select courses from the menu.
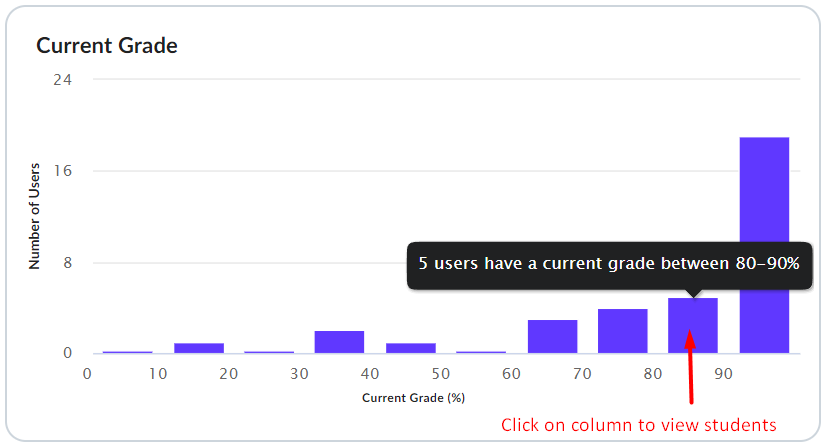
- Click on a column on the Current Grade visualization card to show student details.
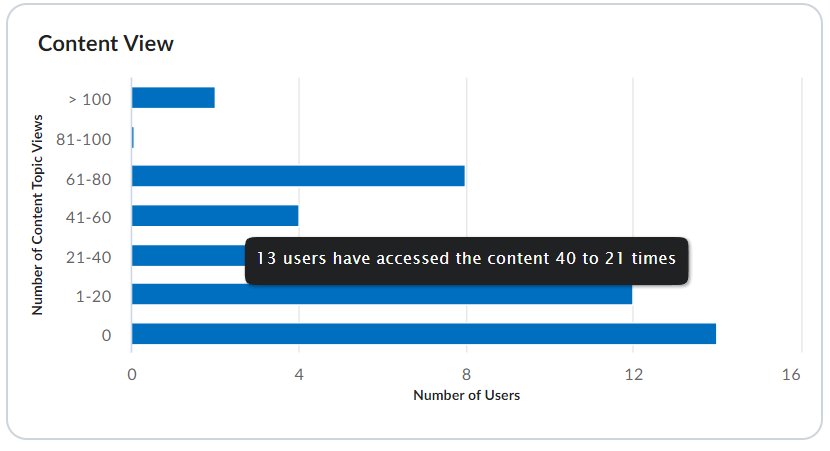
- Click on a bar on the Content View visualization card to view student details.
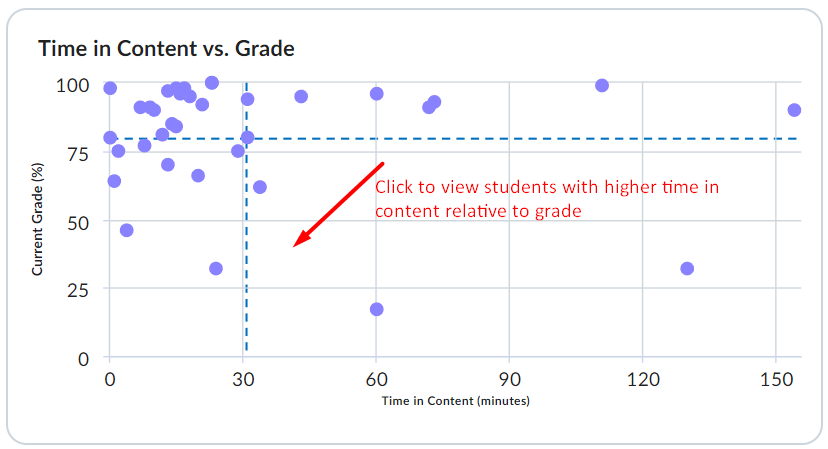
- Click on the Time in Content vs. Grade visualization card to view student grades relative to time spent in Content.
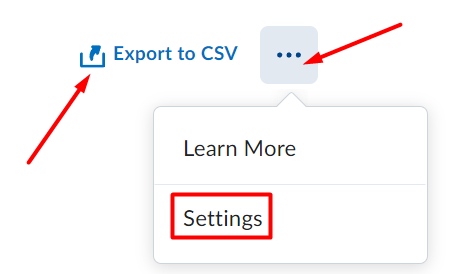
- Choose Export to CSV or select the ellipsis to modify student engagement metrics.